The Analytics Dashboard gives you clear, actionable insights into your sales performance. All in one easy-to-use interface.
You can track, monitor, and compare data across any time period, helping you make confident, data-driven decisions.
Group Level Insights
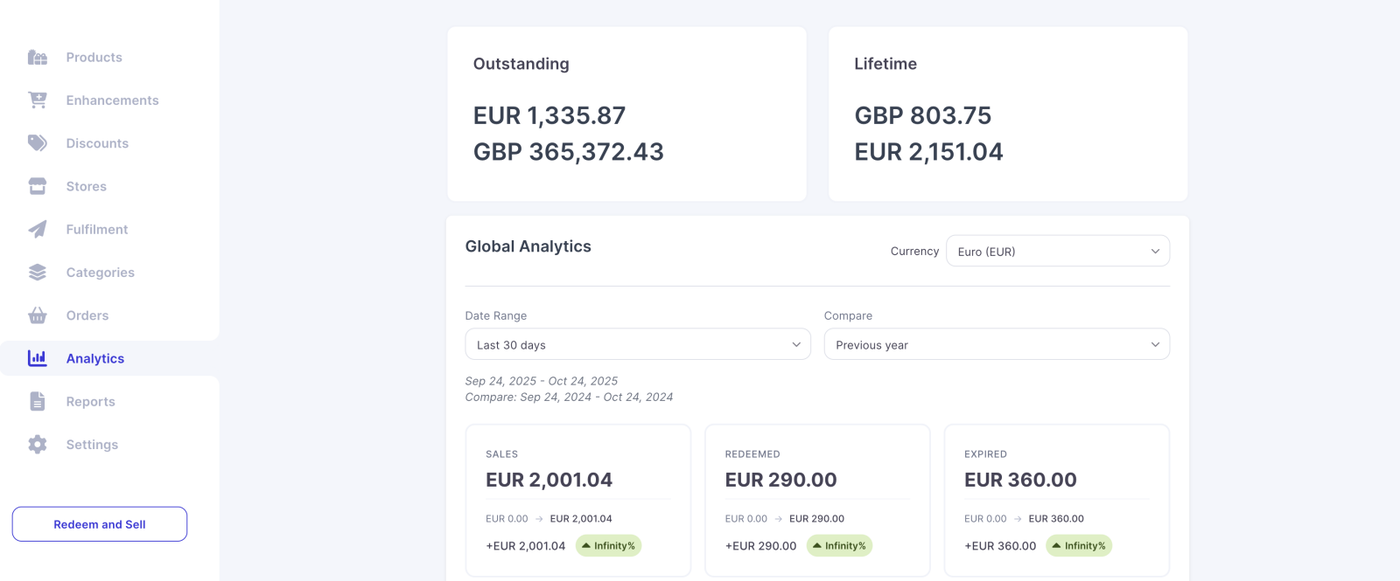
The Group Level Insights section provides a complete overview of your overall business performance.
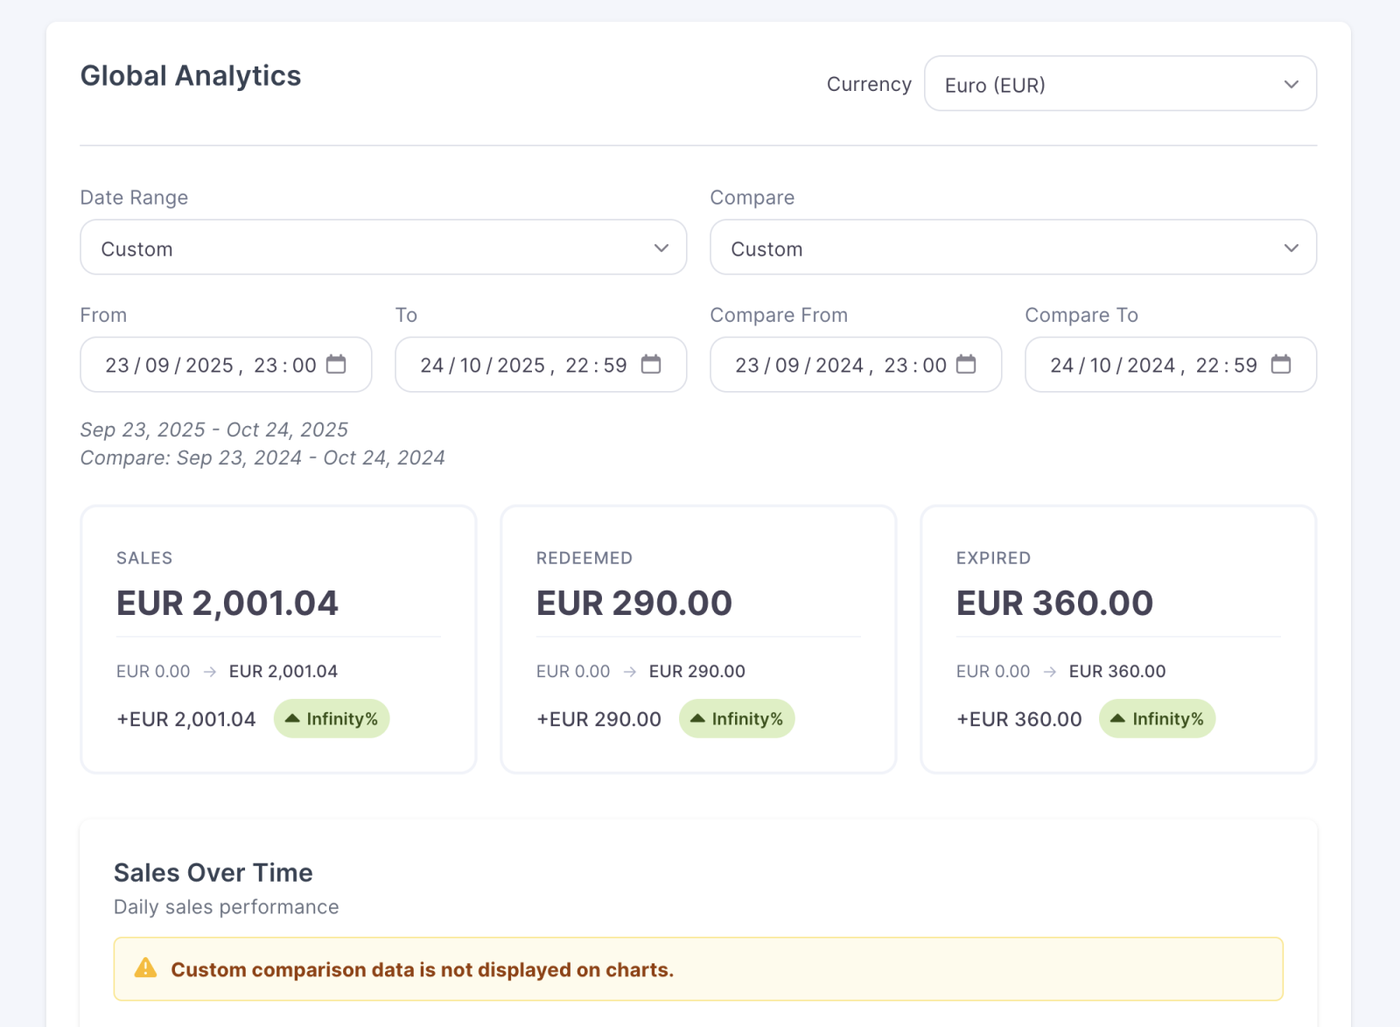
You can apply custom date ranges and compare results with previous periods to see trends and progress over time.
Available Metrics:
-
Account Outstanding – View your current outstanding account balance at a glance.
-
Lifetime Account Sales – Track your total sales growth over time.
-
Total Sales, Redemptions & Expiries – Analyse overall performance within any selected period.
-
Sales Over Time – Monitor daily sales trends and seasonal patterns.
-
Top Sales by Store – See which stores are generating the highest sales.
-
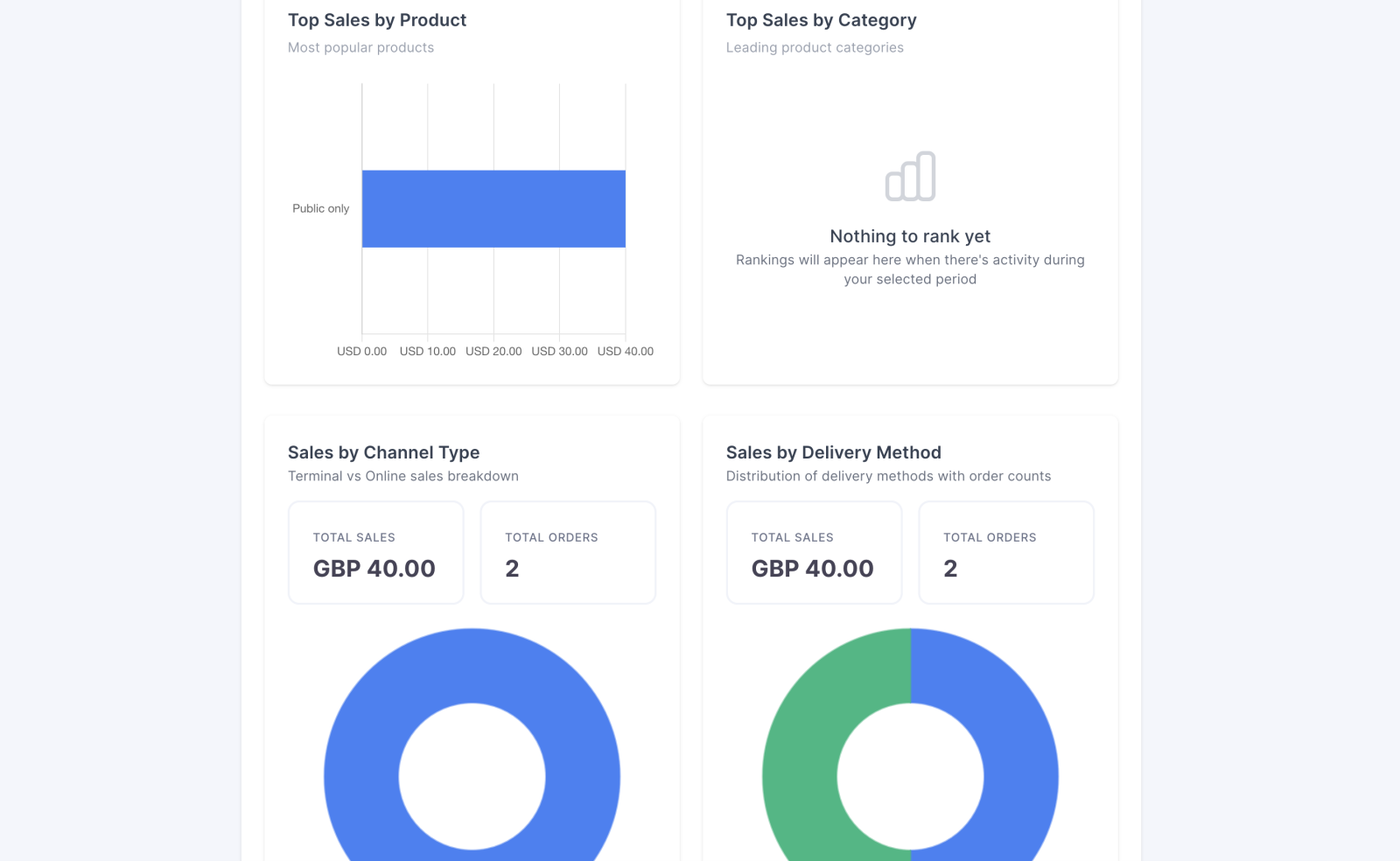
Top Sales by Product & Category – Identify your best-performing products and categories.
-
Top Redemptions by Location – Discover where vouchers are being redeemed most often.
-
Sales by Promotion – Evaluate how your marketing campaigns and promotions are performing.
Individual Store Analytics
Each store has its own dedicated analytics view, giving you more detailed insights into individual performance.
With flexible date comparisons and breakdowns by sales channel, you can understand exactly what’s driving results at every level.
Available Metrics:
-
Sales Over Time – Visualise sales trends and identify patterns across any period.
-
Sales by Product & Category – Pinpoint top-selling products and identify underperforming lines.
-
Sales by Channel Type – Compare performance across online, in-store, or partner sales.
-
Sales by Delivery Method – See how customers are choosing to receive their vouchers (e.g., email, post, or in-person).
-
Sales by Promotion – Measure the effectiveness of active promotions and campaigns.
Tips for Using the Dashboard
-
Use the date range selector to filter your data for any period.
-
Enable comparison mode to view changes between two time periods.
-
Hover over charts for more detailed figures and tooltips.
-
For best results, review your data regularly to identify trends and areas for improvement.